高精度空间转录组平台分析框架(python版本)
原创高精度空间转录组平台分析框架(python版本)
原创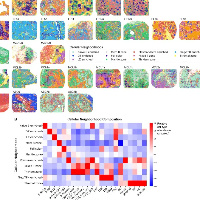
追风少年i
发布于 2024-05-10 14:18:49
发布于 2024-05-10 14:18:49
作者,Evil Genius
现在的趋势是空间转录组都走向了高精度平台,包括现在的10X HD、10X Xenium、华大、百迈客的平台,包括空间蛋白组常用的CODEX,那么高精度平台的分析上我们需要注意什么呢?
空间转录组一个关键的方面在量化不同尺度上细胞之间的空间关系,从相邻细胞的相互作用到多种类型细胞的空间网络。
高精度空转平台分析框架
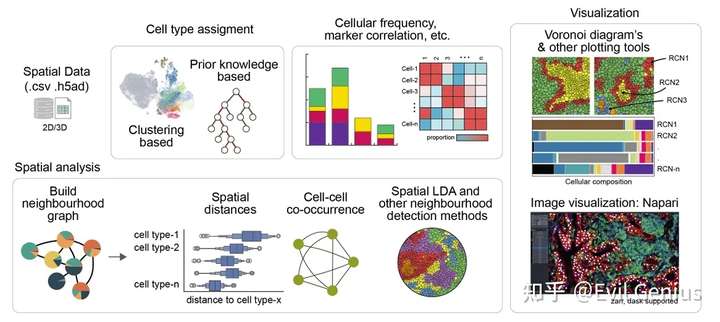
其中包括的分析内容有:
Cell Phenotyping
♂️ Phenotype cells by unsupervised clustering Phenotype cells using a hierarchical probabilistic model Add Regions of Interest (ROIs) for exploration Explore the composition of defined cell types between samples and ROIs
Spatial Analysis
Calculate and visualize distances between cell types Cell-cell interaction/ co-occurrence analysis ⚖️ Compare proximity scores between samples Search for spatial patterns
Cellular Neighbourhoods
Compute neighborhoods using cell-type or cluster information (includes LDA method) Compute neighborhoods using expression data
我们这一篇来填补这些空间分析内容,前面空间降维聚类差异富集的基础处理大家自行分析。
先来看第一个,量化细胞间的距离关系,即拿到如下的结果,这个地方包括多个样本的距离比较处理
# import packages
import anndata as ad
# Load the data that we saved in the last tutorial (with ROIs added)
adata = ad.read_h5ad('/Users/aj/Dropbox (Partners HealthCare)/nirmal lab/resources/exemplarData/scimapExampleData/scimapExampleData.h5ad')
Compute the distances among cell types
import scimap as sm
adata = sm.tl.spatial_distance (adata, phenotype='phenotype')####就是细胞类型
sm.pl.spatial_distance (adata, figsize=(5,4))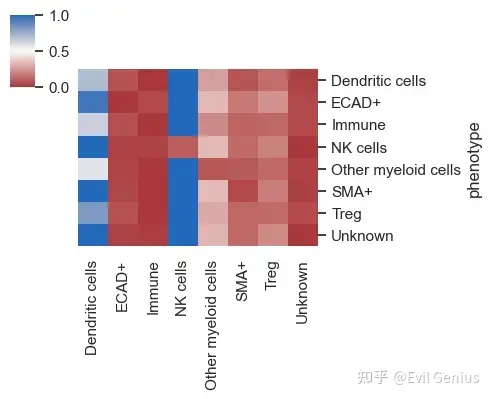
对于包含多个图像的数据集,默认行为是对所有图像的距离取平均值。
sm.pl.spatial_distance (adata, heatmap_summarize=False, figsize=(9,4))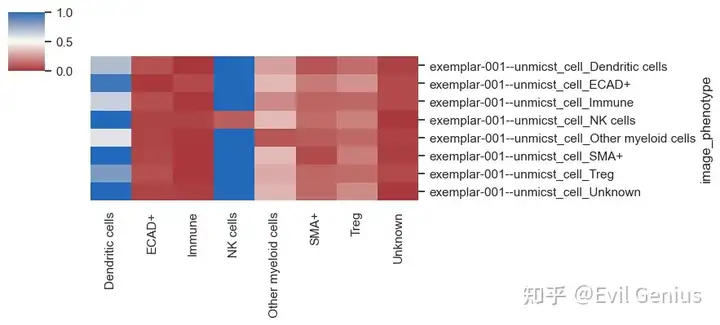
感兴趣的ROI
sm.pl.spatial_distance (adata, heatmap_summarize=False, imageid='ROI', figsize=(7,5))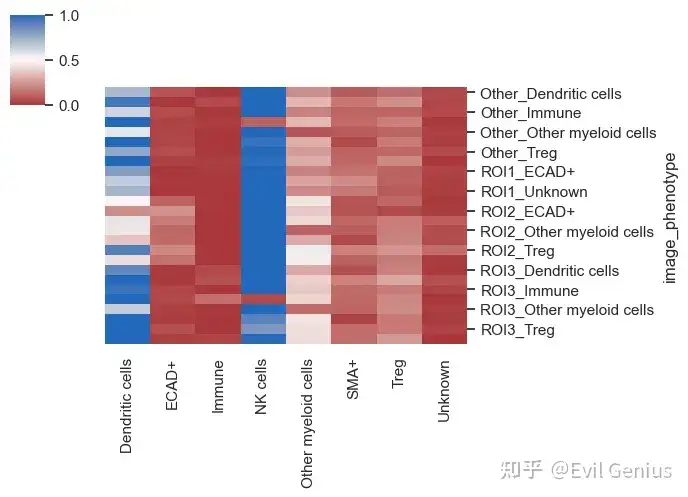
指定具体的细胞类型计算距离关系
sm.pl.spatial_distance (adata, method='numeric',distance_from='ECAD+', height=3, aspect=11/8)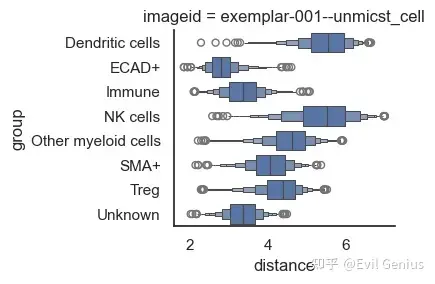
sm.pl.spatial_distance (adata, method='numeric',distance_from='ECAD+', log=True, height=3, aspect=11/8)sm.pl.spatial_distance (adata, method='numeric',distance_from='ECAD+', log=True, imageid='ROI', height=3, aspect=9/8)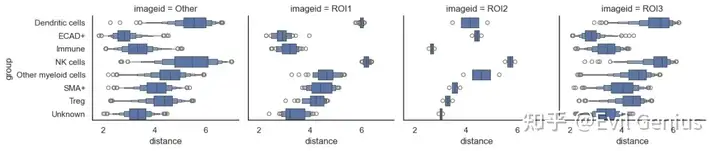
distance_to = ['SMA+', 'Treg', 'NK cells', 'Dendritic cells']
sm.pl.spatial_distance (adata, method='numeric',
                        distance_from='ECAD+', distance_to=distance_to,
                        log=True, imageid='ROI',
                        height=3, aspect=9/8)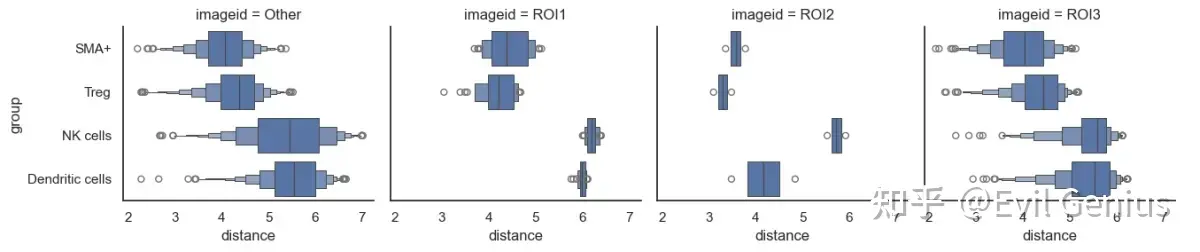
sm.pl.spatial_distance (adata, method='distribution',distance_from='ECAD+',distance_to = 'SMA+', imageid='ROI', log=True, height=3, aspect=9/8)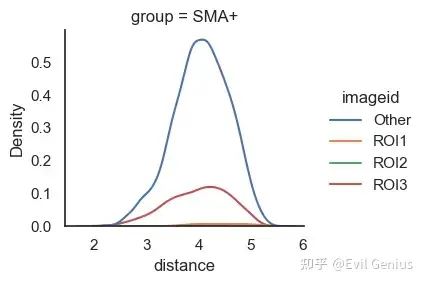
第二部分,空间通讯与共定位分析
# import packages
import scimap as sm
import anndata as ad
# Load the data that we saved in the last tutorial (with ROIs added)
adata = ad.read_h5ad('/Users/aj/Dropbox (Partners HealthCare)/nirmal lab/resources/exemplarData/scimapExampleData/scimapExampleData.h5ad')
####Run spatial interaction tool
adata = sm.tl.spatial_interaction (adata,
                                  method='radius',
                                  radius=70,
                                  label='spatial_interaction_radius')
sm.pl.spatial_interaction(adata,
                          spatial_interaction='spatial_interaction_radius',
                          linewidths=0.75, linecolor='black', figsize=(5,4))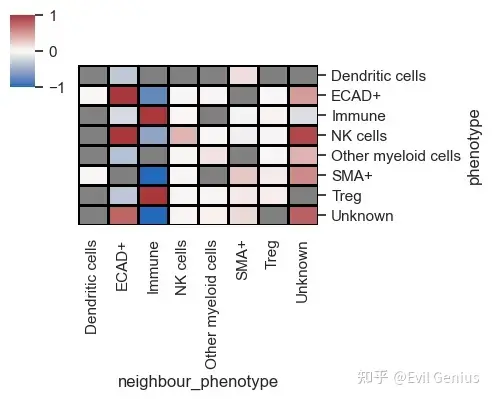
多个图像分析
# rerun the analysis with passing ROI column
adata = sm.tl.spatial_interaction(adata,
                                  method='radius',
                                  imageid = 'ROI',
                                  radius=70,
                                  label='spatial_interaction_radius_roi')

# view the results
sm.pl.spatial_interaction(adata,
                          spatial_interaction='spatial_interaction_radius_roi',
                          linewidths=0.75, linecolor='black', figsize=(5,4))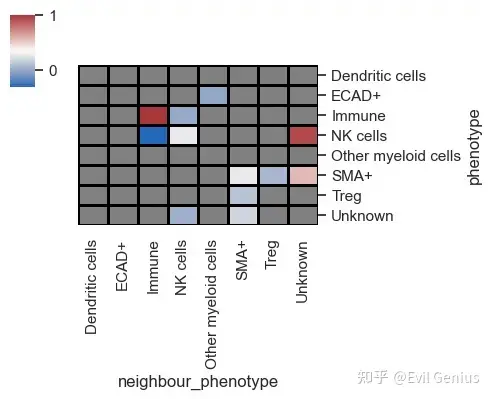
sm.pl.spatial_interaction(adata,
                          spatial_interaction='spatial_interaction_radius_roi',
                          yticklabels=True, figsize=(5,10), row_cluster=True,
                          summarize_plot=False,
                          linewidths=0.75, linecolor='black')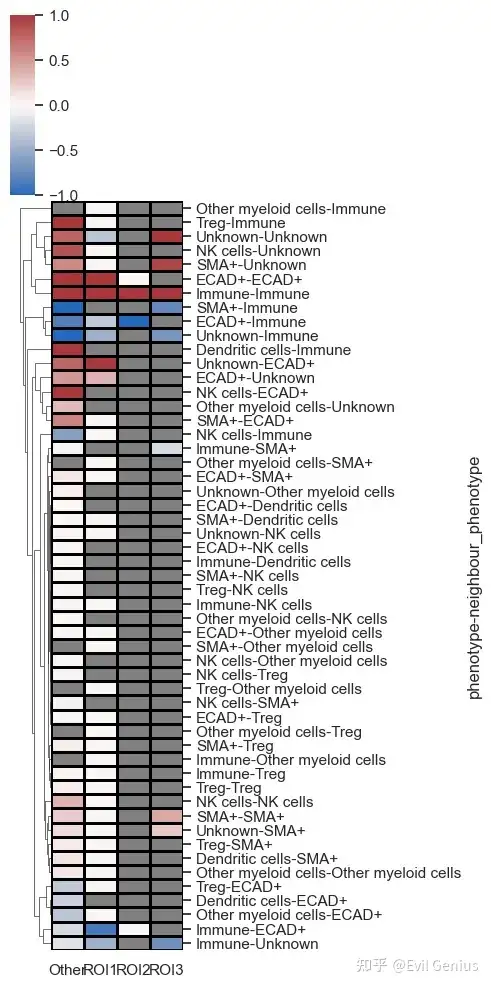
sm.pl.spatial_interaction(adata,
                          spatial_interaction='spatial_interaction_radius',  binary_view=True,
                          linewidths=0.75, linecolor='black', figsize=(5,4))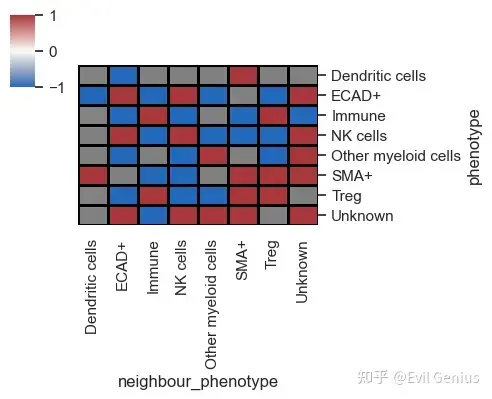
空间互作网络
sm.pl.spatialInteractionNetwork(adata, spatial_interaction='spatial_interaction_radius', figsize=(6,4))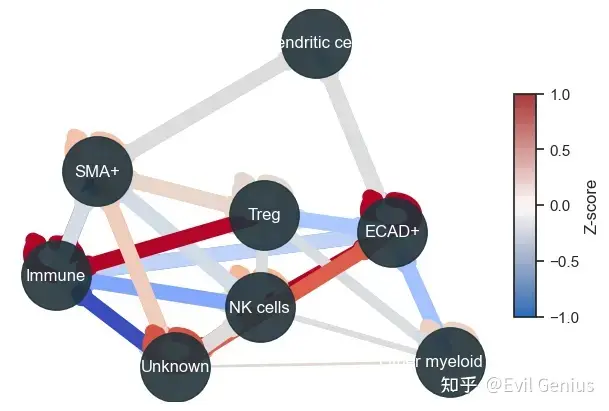
第三部分:比较样本之间的接近度得分
- Proximity Density reflects the ratio of identified interactions to the total number of cells of the interacting types, providing insight into how frequently these cell types interact relative to their population size.
- Proximity Volume, on the other hand, compares the number of interactions to the total cell count in the dataset, offering a broader view of the interaction's significance across the entire sample.
# Calculate the score for proximity between `Tumor` cells and `Blood Vessels`
adata =  sm.tl.spatial_pscore (adata,proximity= ['ECAD+', 'SMA+'],
                               score_by = 'ROI',
                               phenotype='phenotype',
                               method='radius',
                               radius=50)
sm.pl.spatial_pscore (adata, color='black', plot_score='Proximity Volume', figsize=(4,2))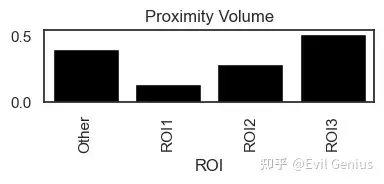
sm.pl.spatial_pscore (adata, color='Black', plot_score='Proximity Density', figsize=(4,2))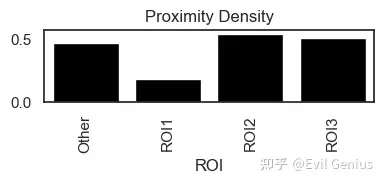
第四部分:空间邻域
# import packages
import scimap as sm
import anndata as ad

# Load the data that we saved in the last tutorial (with ROIs added)
adata = ad.read_h5ad('/Users/aj/Dropbox (Partners HealthCare)/nirmal lab/resources/exemplarData/scimapExampleData/scimapExampleData.h5ad')

adata = sm.tl.spatial_count(adata, phenotype='phenotype', method='radius', radius=80, label='spatial_count')

# note that the df_name parameter needs to the same as the label used in the previous step.
adata = sm.tl.spatial_cluster(adata, df_name='spatial_count', method='kmeans', k=6, label='neigh_kmeans')

# Let's visualize the results.
sm.pl.voronoi(adata, color_by='neigh_kmeans',
                 voronoi_edge_color = 'black',
                 voronoi_line_width = 0.3,
                 voronoi_alpha = 0.8,
                 size_max=3000,
                 overlay_points=None,
                 plot_legend=True,
                 legend_size=6)

# Let's plot the composition of these neighbourhoods
sm.pl.stacked_barplot (adata, x_axis='neigh_kmeans', y_axis='phenotype')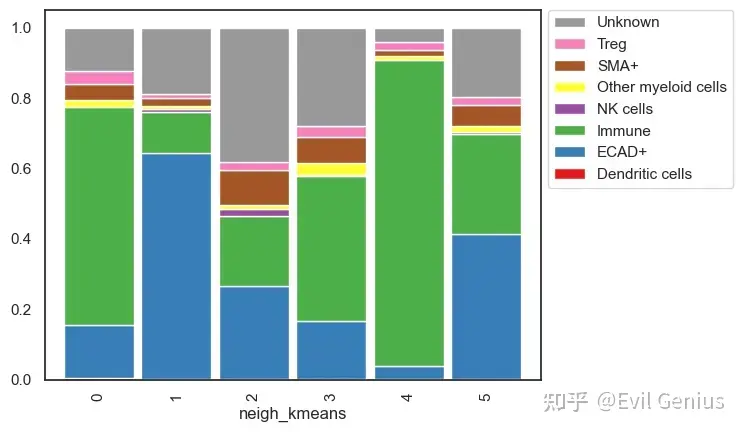
sm.pl.groupCorrelation(adata, groupBy='phenotype', condition='neigh_kmeans', figsize=(6,4))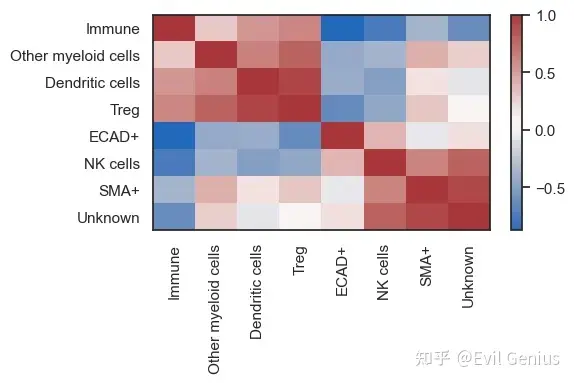
还有很多其他的内容,大家自己查看吧,参考地址在scimap, https://scimap.xyz/tutorials/md/spatial_biology_scimap/
如果觉得有用,辛苦打赏一下,您的支持就是继续的动力
生活很好,有你更好
原创声明:本文系作者授权腾讯云开发者社区发表,未经许可,不得转载。
如有侵权,请联系 cloudcommunity@tencent.com 删除。
原创声明:本文系作者授权腾讯云开发者社区发表,未经许可,不得转载。
如有侵权,请联系 cloudcommunity@tencent.com 删除。
评论
登录后参与评论
推荐阅读
目录